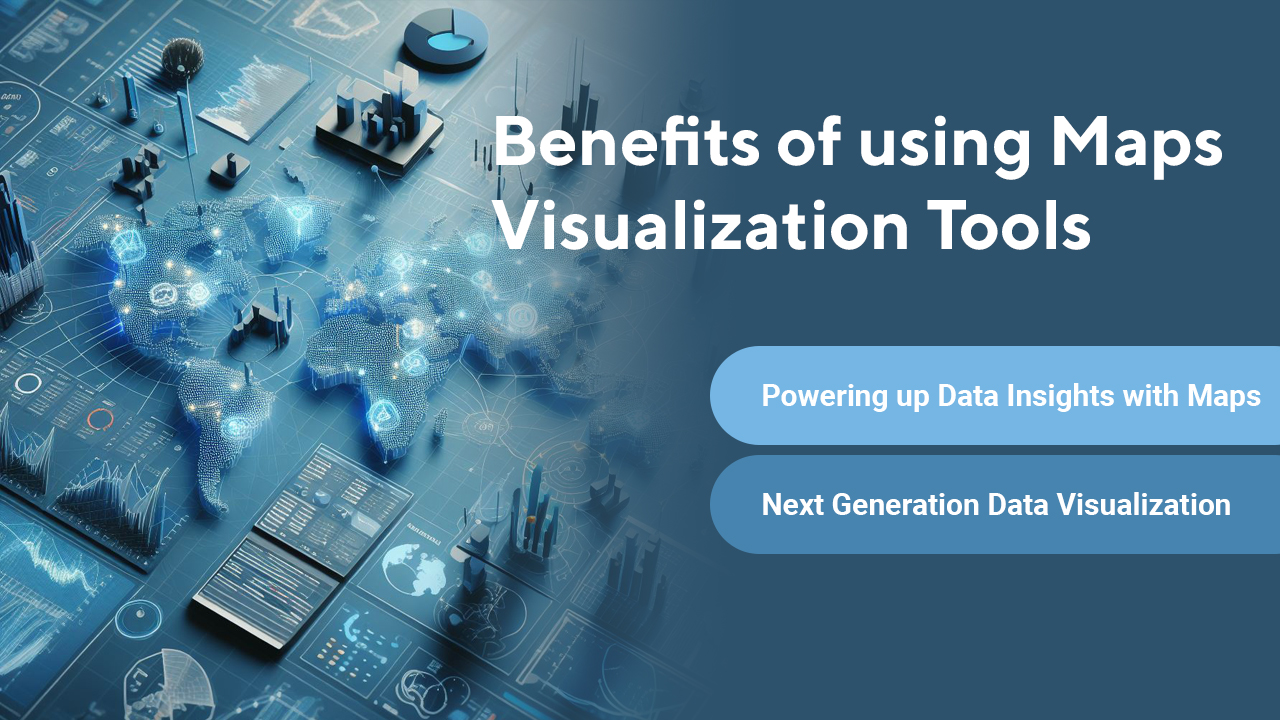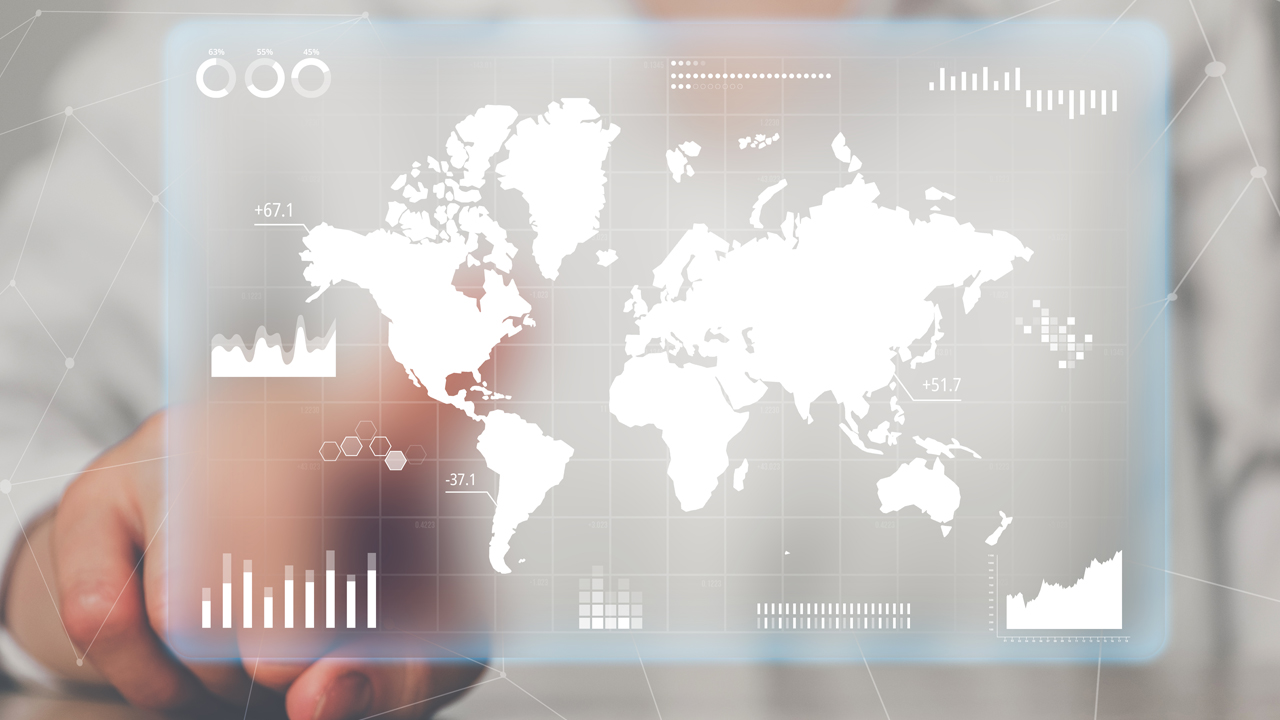
Unveiling the Power of Maps Visualization Tools: A Journey into Spatial Insight
The use of map visualization tools has become increasingly popular in recent years. In the era of data-driven decision-making, the significance of visualizing information cannot be overstated. Among the myriad tools available, map visualization stands out as a potent means to unravel patterns, trends, and insights that may otherwise remain concealed in raw data sets. In this blog post, we will delve into the compelling reasons why you should harness the power of map visualization tools and explore real-world examples that underscore their transformative potential.
What are Interactive Maps Visualization Tools?
Interactive Maps are dynamic visualizations that allow users to explore geographical data in real-time. Users can zoom in, pan, and click on map elements to access additional information. These maps enhance user engagement by providing an immersive experience. Overall, maps data visualization is a powerful tool for decision-making, analysis, and communication. Providing a spatial context that enhances the understanding of data on Maps.
Here is the list of benefits by using Maps Visualization Tools for all types of business:
1. Geographic Context Enhances Understanding:
Maps provide a unique spatial context that is often crucial for understanding data. Whether you are dealing with sales figures, demographic information, or environmental data, the geographical context offers an additional layer of comprehension. For instance, visualizing sales data on a map allows businesses to identify regional trends and target areas with untapped potential.
Example: Imagine a retail business especially ecommerce business analyzing sales performance across different regions. A map visualization could reveal that certain products sell exceptionally well in specific geographic areas, it will helps to leading the company to tailor marketing strategies to capitalize on these regional preferences.
2. Spotting Trends and Patterns:
Patterns and trends that may go unnoticed in tabular data become glaringly evident when presented on a map. By overlaying different data sets, map visualization tools enable users to discern correlations and patterns that might be elusive in traditional data formats. This aids in making informed decisions based on a holistic understanding of the data.
Example: Environmental researchers studying the impact of climate change can use map visualization tools to overlay temperature data with deforestation rates. This visual approach can reveal correlations between rising temperatures and deforestation patterns, facilitating a more comprehensive analysis of environmental changes.
3. Enhanced Communication and Storytelling
Maps have an innate ability to convey complex information in a simple and intuitive manner. They transform abstract data into a visual narrative that is easily comprehensible to diverse audiences. Whether you are presenting findings to stakeholders, colleagues, or the general public, map visualizations enhance communication and make it easier for others to grasp the significance of the data.
Example: Journalists reporting on social issues can use map visualizations to illustrate the geographical distribution of poverty, education levels, or healthcare accessibility. This approach not only adds depth to the storytelling but also engages the audience by providing a visual anchor for the presented information.
4. Effective Decision-Making and Planning
Map visualization tools empower decision-makers to assess situations more comprehensively. By mapping out data related to resources, demographics, and infrastructure, organizations can make informed decisions about resource allocation, expansion strategies, and risk management.
Example: Urban planners can utilize map visualizations to assess population density, traffic patterns, and public transportation accessibility. This information aids in developing more effective urban development plans, optimizing infrastructure projects, and improving overall city functionality.
5. Real-Time Monitoring and Analysis
In a dynamic world, the ability to monitor and analyze data in real-time is invaluable. Map visualization tools can integrate with live data feeds, enabling organizations to track and respond to changes as they happen. This real-time capability is particularly crucial in fields such as logistics, emergency response, and supply chain management.
Example: Emergency response teams can use map visualizations to monitor the spread of natural disasters, such as wildfires or hurricanes, in real-time. This information allows for more timely and effective deployment of resources to affected areas.

6. Geospatial Analytics Unleashed
Map visualization tools often come equipped with geospatial analytics capabilities, allowing users to perform advanced spatial analysis. This includes proximity analysis, spatial clustering, and geocoding, providing deeper insights into the relationships between different data points.
Example: Businesses with multiple retail locations can leverage geospatial analytics to identify optimal locations for new stores based on factors like customer demographics, competitor proximity, and foot traffic patterns.
7. Accessibility and Collaboration
Modern map visualization tools are designed to be user-friendly, making them accessible to individuals with varying levels of technical expertise. Additionally, many of these tools facilitate collaborative work by allowing multiple users to interact with and contribute to the same map.
This fosters teamwork and ensures that insights from diverse perspectives are considered.
Example: Research teams collaborating on a project can use map visualization tools to share and analyze data collectively. Each team member can contribute their findings, leading to a more comprehensive understanding of the subject matter.
8. Integration with Other Data Sources
Map visualization tools are adept at integrating with a wide array of data sources. This interoperability allows users to combine spatial data with non-spatial data, unlocking new dimensions of analysis. The ability to merge data from various sources provides a more holistic view of the subject under investigation.
Example: Healthcare professionals studying the spread of infectious diseases can integrate demographic data, travel patterns, and medical facility locations into a map visualization. This comprehensive approach aids in understanding the dynamics of disease transmission and planning effective public health interventions.
9. Cost-efficiency and Time Savings
Traditionally, analyzing spatial data required specialized skills and significant time investments. Map visualization tools have democratized this process, enabling users to create sophisticated visualizations without extensive training. This not only reduces the cost associated with hiring specialized personnel but also accelerates the decision-making process.
Example: Small businesses without dedicated data analysis teams can use map visualization tools to gain insights into customer demographics, purchasing behavior, and market trends. This cost-effective approach allows them to make informed decisions without the need for extensive resources.
10. Future-proofing Data Analysis
As technology continues to advance, the importance of future-proofing data analysis methods cannot be overstated. Map visualization tools features are at the forefront of this evolution, incorporating machine learning and artificial intelligence capabilities. This ensures that organizations can adapt to evolving data analysis trends and harness the full potential of emerging technologies.
Example: Marketing teams can employ predictive analytics in map visualizations to forecast customer behavior and tailor campaigns accordingly. By staying ahead of trends, organizations can maintain a competitive edge in their respective industries.
Conclusion
In the ever-expanding landscape of data analytics, map visualization tools emerge as indispensable instruments for unlocking the full potential of spatial data. From enhancing understanding and communication to facilitating effective decision-making, the benefits of incorporating map visualization into your data analysis toolkit are multifaceted. By exploring real-world examples and embracing the transformative power of spatial insights, organizations can elevate their data-driven strategies to new heights, paving the way for a more informed and connected future.
